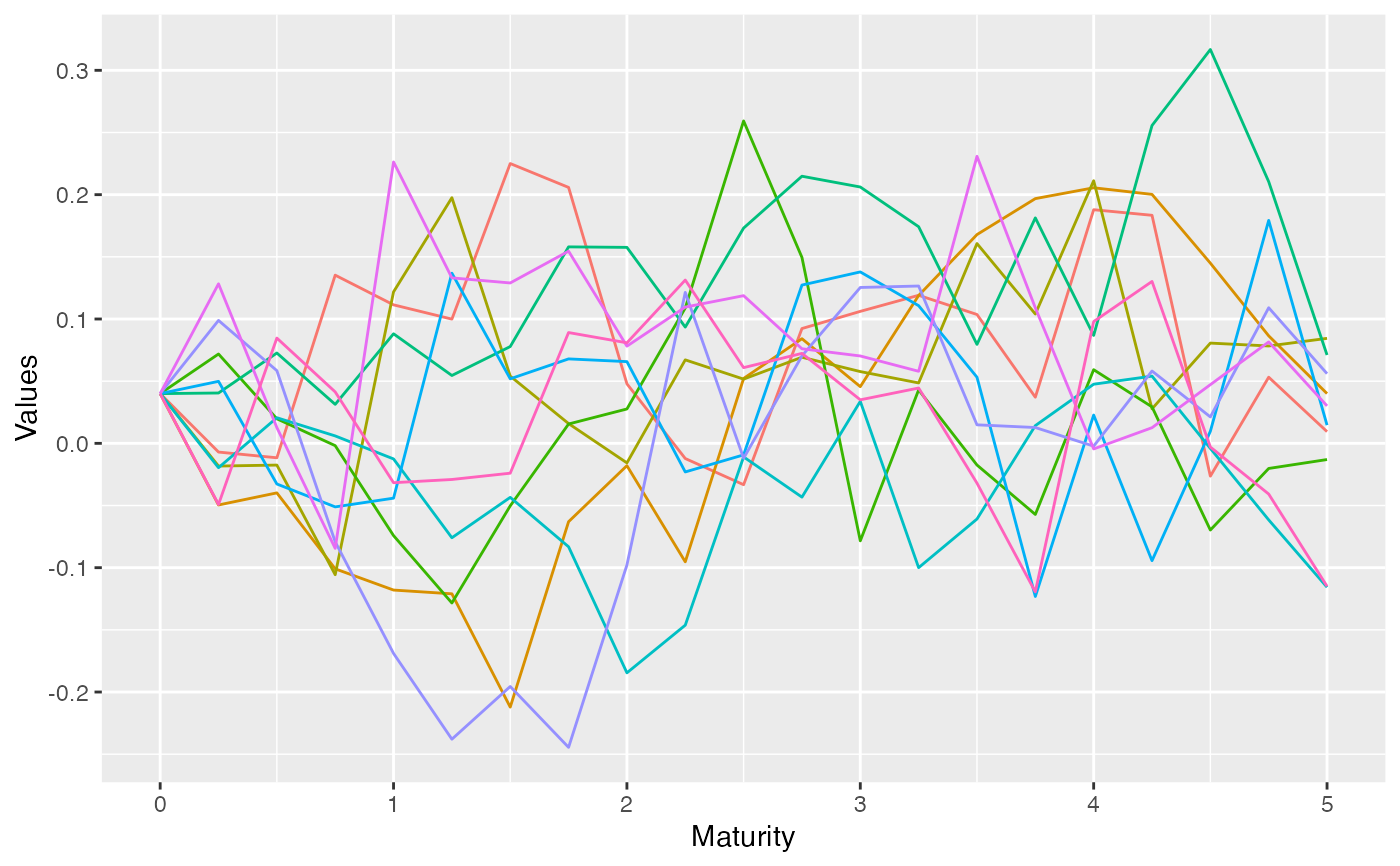
This function plots outputs from simdiff.
esgplotts(x)Arguments
- x
a time series object, an output from
simdiff.
Details
For a large number of simulations, it's preferable to use
esgplotbands for a synthetic view by percentiles.
References
H. Wickham (2009), ggplot2: elegant graphics for data analysis. Springer New York.
See also
Examples
kappa <- 1.5
V0 <- theta <- 0.04
sigma <- 0.2
theta1 <- kappa*theta
theta2 <- kappa
theta3 <- sigma
x <- simdiff(n = 10, horizon = 5, frequency = "quart",
model = "OU",
x0 = V0, theta1 = theta1, theta2 = theta2, theta3 = theta3)

esgplotts(x)
#> Warning: Use of `meltdf$value` is discouraged.
#> ℹ Use `value` instead.