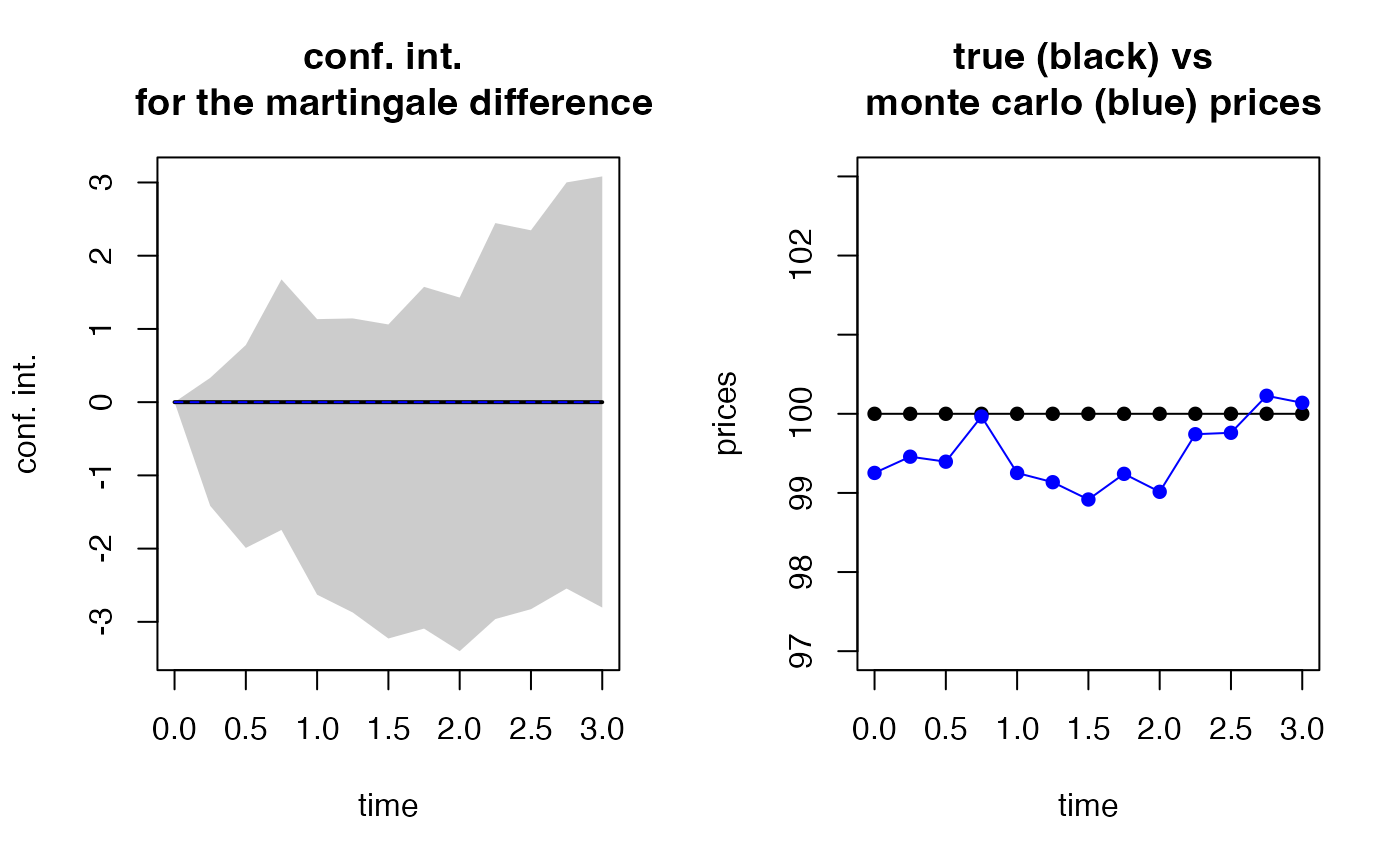
This function performs martingale and market consistency (t-)tests.
esgmartingaletest(r, X, p0, alpha = 0.05, method=c("onevsone",
                                       "trend",
                                       "ratio"))
Arguments
- r
a
numericor a time series object, the risk-free rate(s).- X
a time series object, containing payoffs or projected asset values.
- p0
a
numericor a vector or a univariate time series containing initial price(s) of an asset.- alpha
1 - confidence level for the test. Default value is 0.05.
- method
"onevsone", "trend", "ratio".
Value
The function result can be just displayed. Otherwise, you can get a list by an assignation, containing (for each maturity) :
the Student t values
the p-values
the estimated mean of the martingale difference
Monte Carlo prices
References
T. Moudiki (2024), A test of the Martingale Hypothesis, https://www.researchgate.net/publication/388490056_A_test_of_the_martingale_hypothesis
See also
Examples
r0 <- 0.03
S0 <- 100

set.seed(10)
eps0 <- simshocks(n = 100, horizon = 3, frequency = "quart")
sim.GBM <- simdiff(n = 100, horizon = 3, frequency = "quart",
               model = "GBM",
               x0 = S0, theta1 = r0, theta2 = 0.1,
               eps = eps0, seed=10)

mc.test <- esgmartingaletest(r = r0, X = sim.GBM, p0 = S0,
alpha = 0.05)
#>
#>  martingale '1=1' one Sample t-test
#>
#>  alternative hypothesis: true mean of the martingale difference is not equal to 0
#>
#> df =  99
#>                t   p-value
#> 0 Q2 -1.23133508 0.2211146
#> 0 Q3 -0.86706246 0.3880045
#> 0 Q4 -0.03979258 0.9683386
#> 1 Q1 -0.78853728 0.4322667
#> 1 Q2 -0.85421446 0.3950485
#> 1 Q3 -1.00243504 0.3185774
#> 1 Q4 -0.64526489 0.5202482
#> 2 Q1 -0.81032744 0.4196956
#> 2 Q2 -0.18944936 0.8501285
#> 2 Q3 -0.18407588 0.8543305
#> 2 Q4  0.16306302 0.8708012
#> 3 Q1  0.09358936 0.9256245
#>
#> 95 percent confidence intervals for the mean :
#>      c.i lower bound c.i upper bound
#> 0 Q1        0.000000       0.0000000
#> 0 Q2       -1.415461       0.3314127
#> 0 Q3       -1.990430       0.7798667
#> 0 Q4       -1.744826       1.6762189
#> 1 Q1       -2.629092       1.1337289
#> 1 Q2       -2.872560       1.1435895
#> 1 Q3       -3.227314       1.0608930
#> 1 Q4       -3.092177       1.5745601
#> 2 Q1       -3.400502       1.4284311
#> 2 Q2       -2.961712       2.4454467
#> 2 Q3       -2.826997       2.3470049
#> 2 Q4       -2.545313       3.0011186
#> 3 Q1       -2.804901       3.0825960
esgplotbands(mc.test)
