Basic forecasting (mean, median, random walk)
basicf.RdBasic forecasting functions for multivariate time series
Arguments
- y
A multivariate time series of class
tsor a matrix- h
Forecasting horizon
- level
Confidence level for prediction intervals
- method
forecasting method, either "mean", "median", or random walk ("rw")
- type_pi
type of prediction interval currently, "gaussian", "bootstrap", "blockbootstrap" or "movingblockbootstrap"
- block_length
length of block for (circular) "blockbootstrap" or "movingblockbootstrap"
- seed
reproducibility seed for
type_pi == 'bootstrap'- B
Number of bootstrap replications for
type_pi == 'bootstrap'- show_progress
A boolean; show progress bar for bootstrapping? Default is TRUE.
Value
An object of class "mtsforecast"; a list containing the following elements:
- method
The name of the forecasting method as a character string
- mean
Point forecasts for the time series
- lower
Lower bound for prediction interval
- upper
Upper bound for prediction interval
- sims
Model simulations for bootstrapping (basic, or block)
- x
The original time series
- residuals
Residuals from the fitted model
- coefficients
Regression coefficients for
type_pi == 'gaussian'for now
Examples
require(fpp)
#> Loading required package: fpp
#> Loading required package: fma
#> Loading required package: expsmooth
#> Loading required package: lmtest
#> Loading required package: zoo
#>
#> Attaching package: ‘zoo’
#> The following objects are masked from ‘package:base’:
#>
#>     as.Date, as.Date.numeric

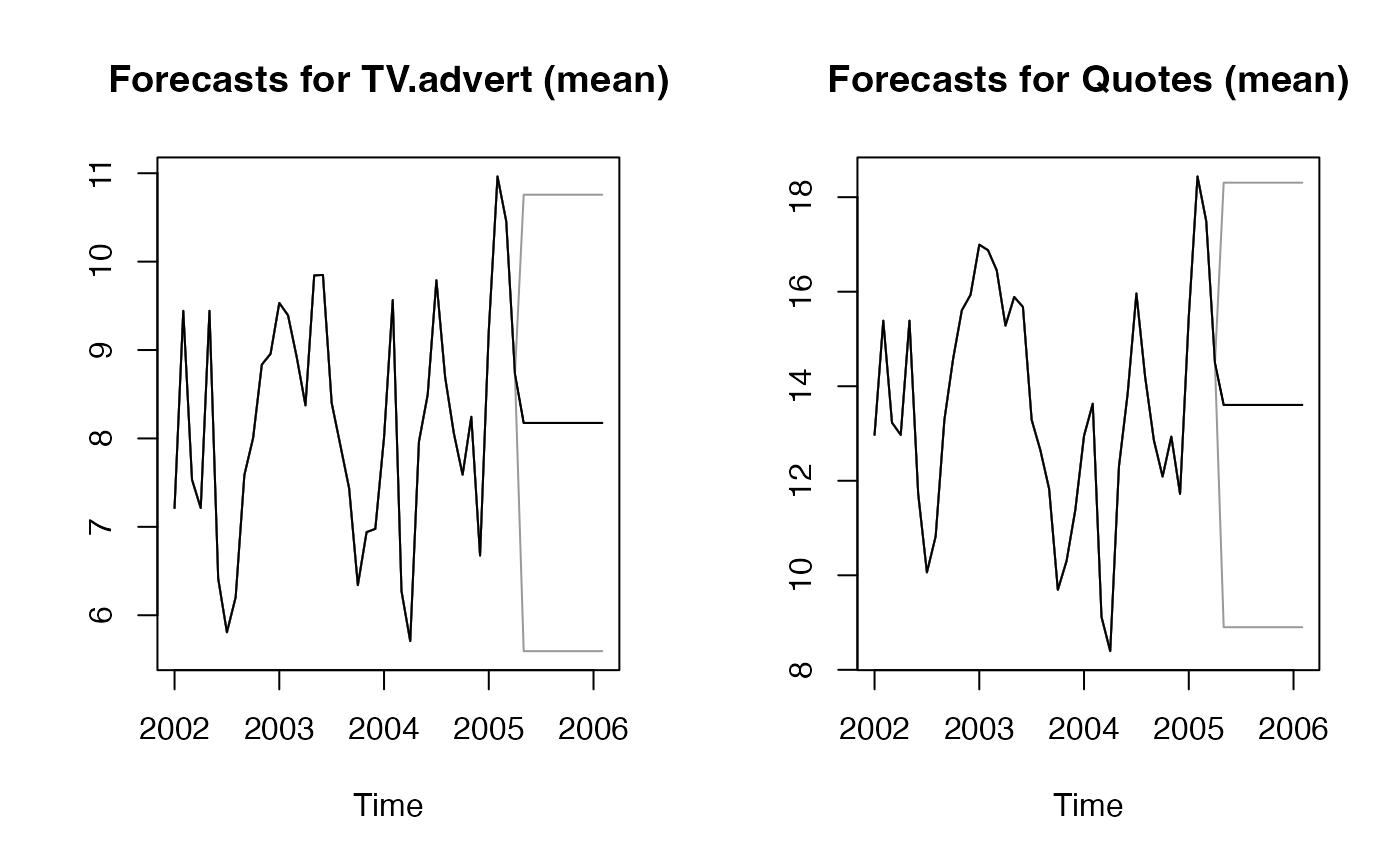
res <- ahead::basicf(fpp::insurance, h=10)
par(mfrow=c(1, 2))
plot(res, "TV.advert")
plot(res, "Quotes")


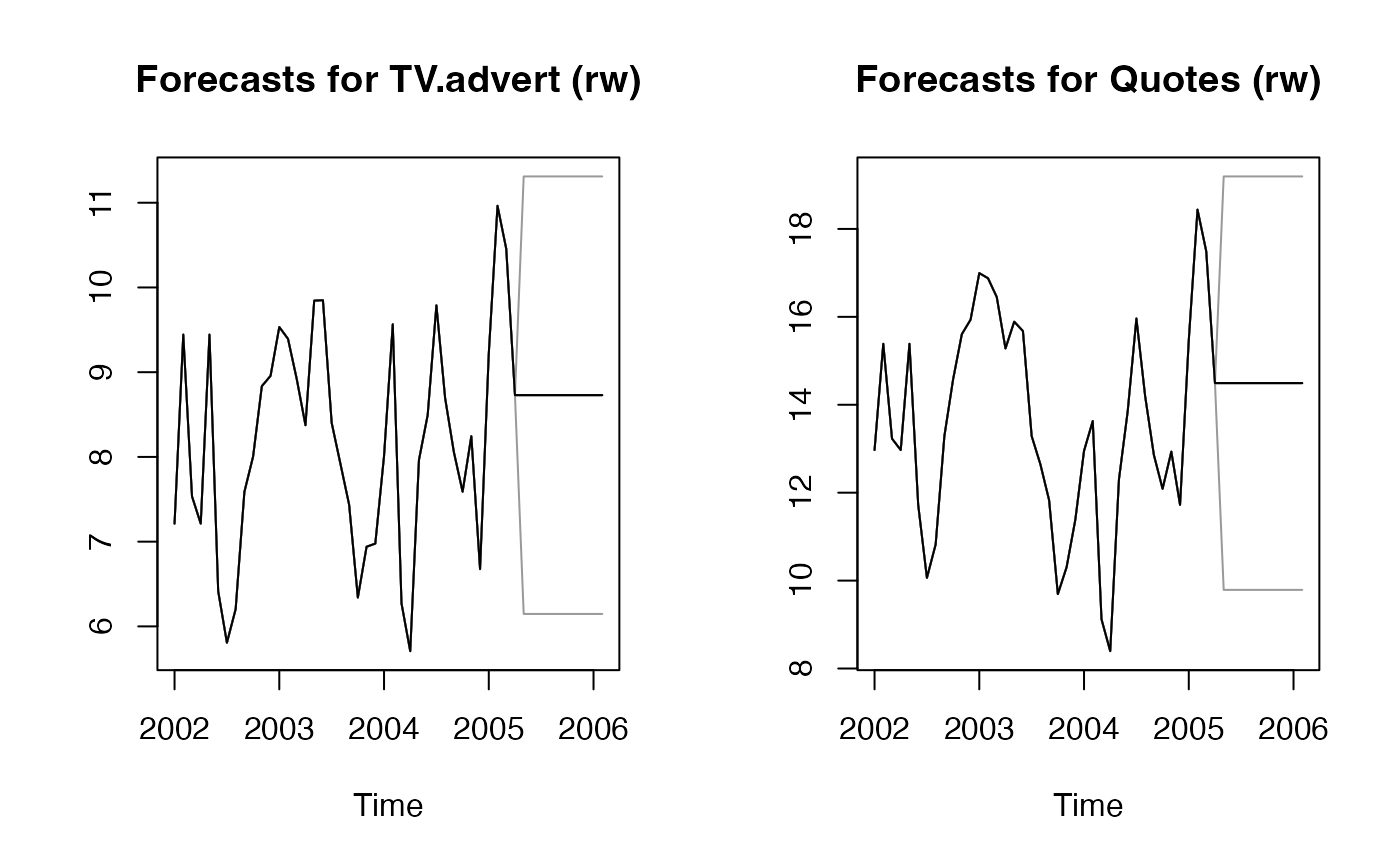
res <- ahead::basicf(fpp::insurance, method="rw", h=10)
par(mfrow=c(1, 2))
plot(res, "TV.advert")
plot(res, "Quotes")


# block bootstrap
res3 <- ahead::basicf(fpp::insurance, h=10, type_pi = "bootstrap", B=10)
#>
  |
  |                                                                      |   0%
  |
  |=======                                                               |  10%
  |
  |==============                                                        |  20%
  |
  |=====================                                                 |  30%
  |
  |============================                                          |  40%
  |
  |===================================                                   |  50%
  |
  |==========================================                            |  60%
  |
  |=================================================                     |  70%
  |
  |========================================================              |  80%
  |
  |===============================================================       |  90%
  |
  |======================================================================| 100%
res5 <- ahead::basicf(fpp::insurance, h=10, type_pi = "blockbootstrap", B=10,
                      block_length = 4)
#>
  |
  |                                                                      |   0%
  |
  |=======                                                               |  10%
  |
  |==============                                                        |  20%
  |
  |=====================                                                 |  30%
  |
  |============================                                          |  40%
  |
  |===================================                                   |  50%
  |
  |==========================================                            |  60%
  |
  |=================================================                     |  70%
  |
  |========================================================              |  80%
  |
  |===============================================================       |  90%
  |
  |======================================================================| 100%

print(res3$sims[[2]])
#>            Quotes TV.advert
#> May 2005  9.69184  6.340490
#> Jun 2005  9.12098  6.272510
#> Jul 2005 12.97065  7.212725
#> Aug 2005 12.97065  7.212725
#> Sep 2005 13.28780  8.402730
#> Oct 2005 15.88901  9.844505
#> Nov 2005 12.30076  7.963540
#> Dec 2005 12.93375  8.244881
#> Jan 2006 12.64484  7.920675
#> Feb 2006 15.93515  8.957255
print(res5$sims[[2]])
#>            Quotes TV.advert
#> May 2005 12.97065  7.212725
#> Jun 2005 15.38714  9.443570
#> Jul 2005 13.22957  7.534250
#> Aug 2005 12.97065  7.212725
#> Sep 2005 11.72288  6.415215
#> Oct 2005 10.06177  5.806990
#> Nov 2005 10.82279  6.203600
#> Dec 2005 13.28707  7.586430
#> Jan 2006  9.69184  6.340490
#> Feb 2006 10.30415  6.939995

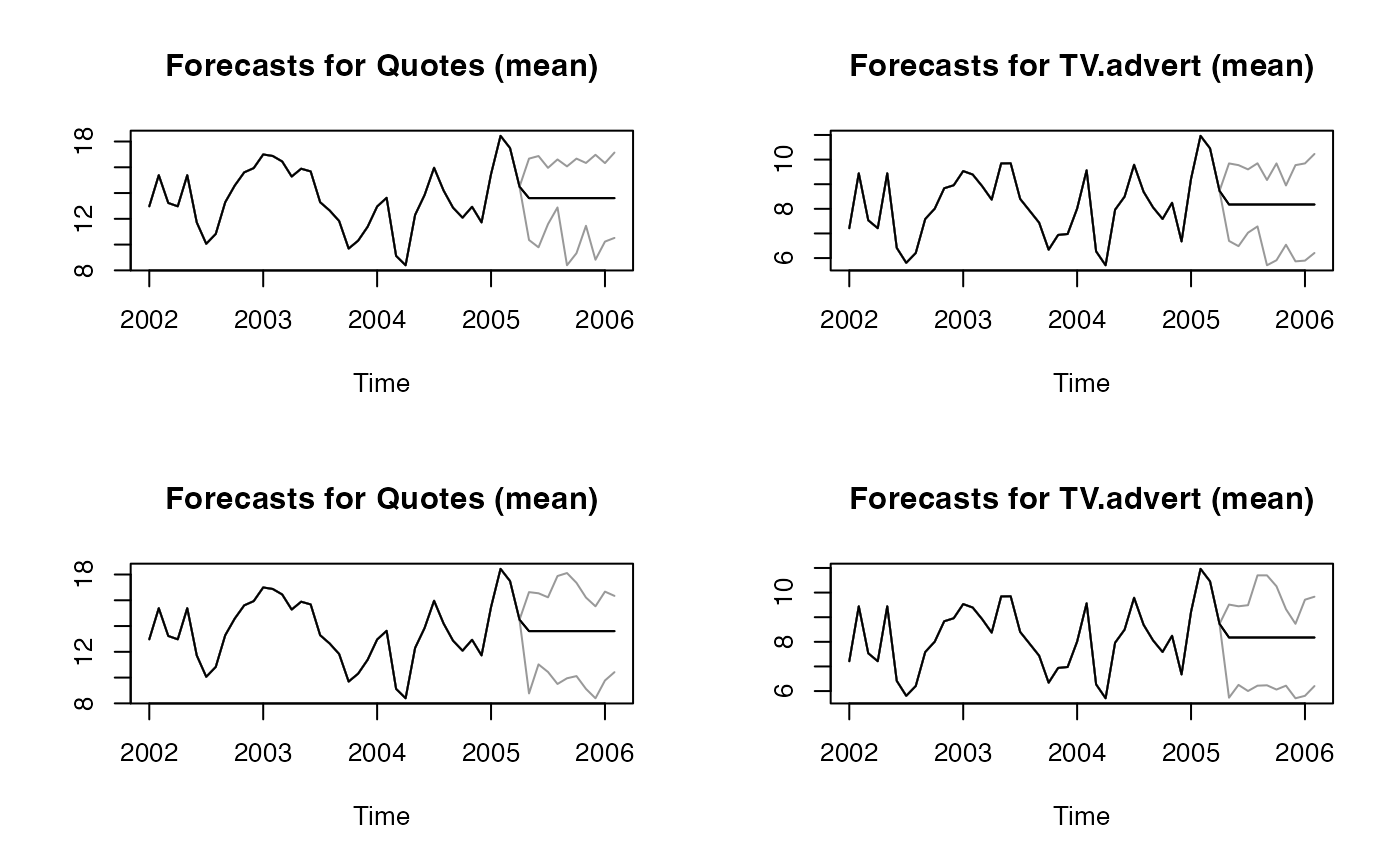
par(mfrow=c(2, 2))
plot(res3, "Quotes")
plot(res3, "TV.advert")
plot(res5, "Quotes")
plot(res5, "TV.advert")


# moving block bootstrap
res6 <- ahead::basicf(fpp::insurance, h=10,
                      type_pi = "movingblockbootstrap", B=10,
                      block_length = 4, method = "rw")
#>
  |
  |                                                                      |   0%
  |
  |=======                                                               |  10%
  |
  |==============                                                        |  20%
  |
  |=====================                                                 |  30%
  |
  |============================                                          |  40%
  |
  |===================================                                   |  50%
  |
  |==========================================                            |  60%
  |
  |=================================================                     |  70%
  |
  |========================================================              |  80%
  |
  |===============================================================       |  90%
  |
  |======================================================================| 100%

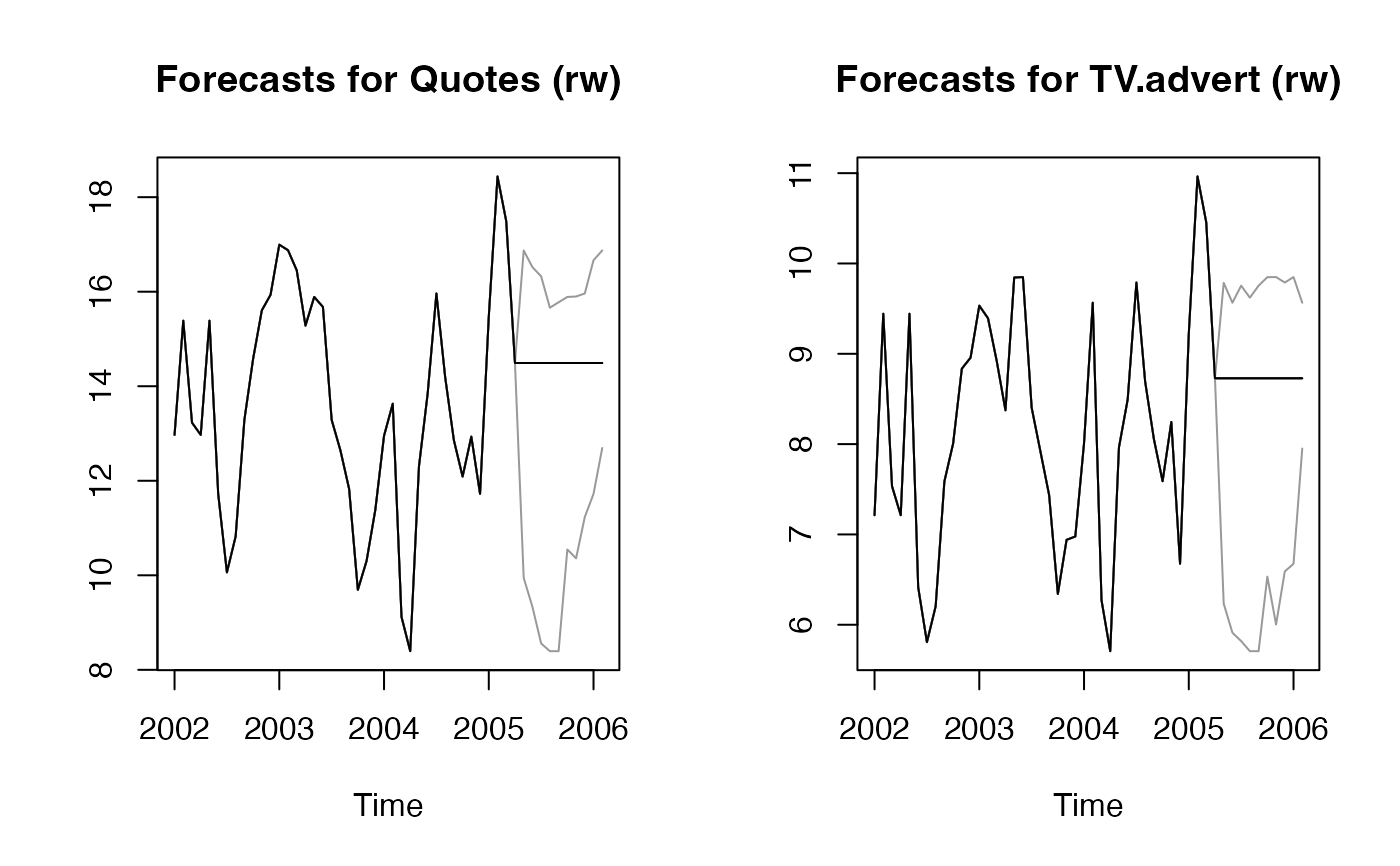
par(mfrow=c(1, 2))
plot(res6, "Quotes")
plot(res6, "TV.advert")
