Dynamic regression model
dynrmf.RdAdapted from forecast::nnetar, with alternative fitting functions (see examples)
dynrmf(
  y,
  h = 5,
  level = 95,
  fit_func = ahead::ridge,
  predict_func = predict,
  fit_params = NULL,
  type_pi = c("gaussian", "E", "A", "T"),
  xreg_fit = NULL,
  xreg_predict = NULL,
  ...
)
Arguments
- y
A numeric vector or time series of class
ts- h
Forecasting horizon
- level
Confidence level for prediction intervals
- fit_func
Fitting function (Statistical/ML model). Default is Ridge regression.
- predict_func
Prediction function (Statistical/ML model)
- fit_params
a list of additional parameters for the fitting function
fit_func(see examples)- type_pi
Type of prediction interval (currently "gaussian", ETS: "E", Arima: "A" or Theta: "T")
- xreg_fit
Optionally, a vector or matrix of external regressors, which must have the same number of rows as y. Must be numeric.
- xreg_predict
Future values of external regressor variables.
- ...
additional parameters
Value
a list; an object of class forecast.
The function summary is used to obtain and print a summary of the
results.
The generic accessor functions fitted.values and residuals
extract useful features.
References
Hyndman, R. J., & Athanasopoulos, G. (2018). Forecasting: principles and practice. OTexts.
Hyndman R, Athanasopoulos G, Bergmeir C, Caceres G, Chhay L,
O'Hara-Wild M, Petropoulos F, Razbash S, Wang E, Yasmeen F (2021).
forecast: Forecasting functions for time series and linear models. R
package version 8.14, <URL: https://pkg.robjhyndman.com/forecast/>.
Examples
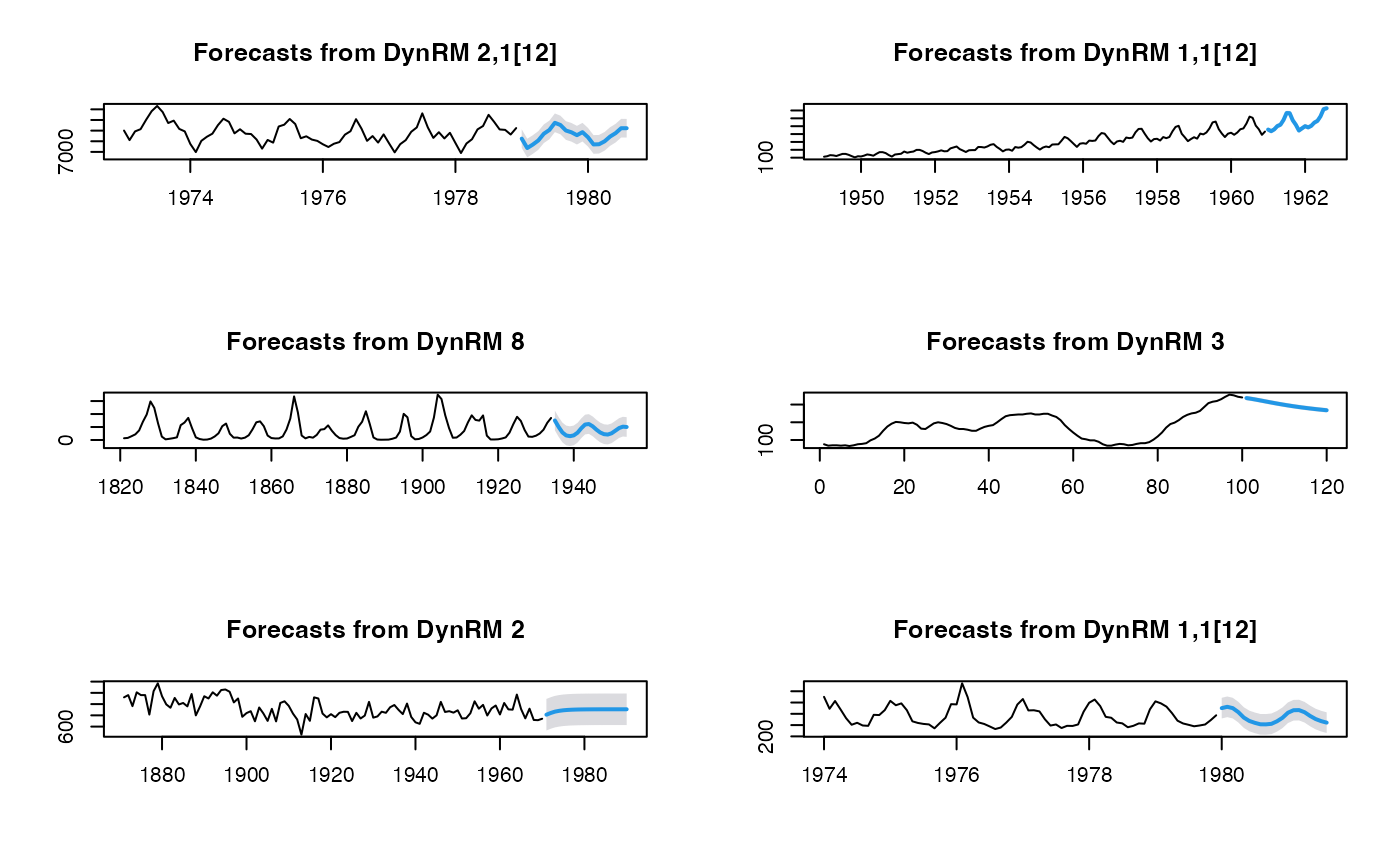
# Example 0: with Ridge regression

par(mfrow=c(3, 2))
plot(dynrmf(USAccDeaths, h=20, level=95))
plot(dynrmf(AirPassengers, h=20, level=95))
plot(dynrmf(lynx, h=20, level=95))
plot(dynrmf(WWWusage, h=20, level=95))
plot(dynrmf(Nile, h=20, level=95))
plot(dynrmf(fdeaths, h=20, level=95))


# Example 1: with Random Forest

if (FALSE) {

require(randomForest)

par(mfrow=c(3, 2))
plot(dynrmf(USAccDeaths, h=20, level=95, fit_func = randomForest::randomForest,
     fit_params = list(ntree = 50), predict_func = predict))
plot(dynrmf(AirPassengers, h=20, level=95, fit_func = randomForest::randomForest,
     fit_params = list(ntree = 50), predict_func = predict))
plot(dynrmf(lynx, h=20, level=95, fit_func = randomForest::randomForest,
     fit_params = list(ntree = 50), predict_func = predict))
plot(dynrmf(WWWusage, h=20, level=95, fit_func = randomForest::randomForest,
     fit_params = list(ntree = 50), predict_func = predict))
plot(dynrmf(Nile, h=20, level=95, fit_func = randomForest::randomForest,
     fit_params = list(ntree = 50), predict_func = predict))
plot(dynrmf(fdeaths, h=20, level=95, fit_func = randomForest::randomForest,
     fit_params = list(ntree = 50), predict_func = predict))
}

# Example 2: with SVM

if (FALSE) {

require(e1071)

par(mfrow=c(2, 2))
plot(dynrmf(fdeaths, h=20, level=95, fit_func = e1071::svm,
fit_params = list(kernel = "linear"), predict_func = predict))
plot(dynrmf(fdeaths, h=20, level=95, fit_func = e1071::svm,
fit_params = list(kernel = "polynomial"), predict_func = predict))
plot(dynrmf(fdeaths, h=20, level=95, fit_func = e1071::svm,
fit_params = list(kernel = "radial"), predict_func = predict))
plot(dynrmf(fdeaths, h=20, level=95, fit_func = e1071::svm,
fit_params = list(kernel = "sigmoid"), predict_func = predict))

}