Combined ets-arima-theta forecasts
eatf.RdCombined ets, arima, and theta (eat) forecasting (uses forecast::ets,
forecast::auto.arima, forecast::thetaf)
Arguments
- y
a univariate time series
- h
number of periods for forecasting
- level
confidence level for prediction intervals
- method
forecasting method: "E" for
forecast::ets; "A"forforecast::auto.arima; "T" forforecast::thetaf; or "EAT" for the combination of the three (default, withweights)- weights
weights for each method, in method
EAT. Must add up to 1.- type_pi
type of prediction interval: currently ETS: "E", Auto.Arima: "A" or Theta: "T"
- ...
additional parameters to be passed to
forecast::ets,forecast::auto.arima,forecast::thetafandforecast::forecast
Value
An object of class "forecast"; a list containing the following elements:
- model
A list containing information about the fitted model
- method
The name of the forecasting method as a character string
- mean
Point forecasts for the time series
- lower
Lower bound for prediction interval
- upper
Upper bound for prediction interval
- x
The original time series
- residuals
Residuals from the fitted model
Details
ensemble forecasts obtained from forecast::ets,
forecast::auto.arima and forecast::theta (with weights)
References
Hyndman R, Athanasopoulos G, Bergmeir C, Caceres G, Chhay L,
O'Hara-Wild M, Petropoulos F, Razbash S, Wang E, Yasmeen F (2021).
forecast: Forecasting functions for time series and linear models. R
package version 8.14, <URL: https://pkg.robjhyndman.com/forecast/>.
Hyndman RJ, Khandakar Y (2008). 'Automatic time series forecasting: the forecast package for R.' Journal of Statistical Software, 26 (3), 1-22. <URL: https://www.jstatsoft.org/article/view/v027i03>.
Assimakopoulos, V. and Nikolopoulos, K. (2000). The theta model: a decomposition approach to forecasting. International Journal of Forecasting 16, 521-530.
Hyndman, R.J., and Billah, B. (2003) Unmasking the Theta method. International J. Forecasting, 19, 287-290.
Examples
require(forecast)

if (FALSE) {

print(ahead::eatf(WWWusage, method = "EAT",
weights = c(0.5, 0, 0.5)))

print(ahead::eatf(WWWusage, method = "EAT"))


obj <- ahead::eatf(WWWusage, method = "EAT",
weights = c(0, 0.5, 0.5), h=10,
type_pi = "T")
plot(obj)


obj <- ahead::eatf(WWWusage, method = "EAT",
weights = c(0, 0.5, 0.5), h=10, type_pi="A")
plot(obj)
}


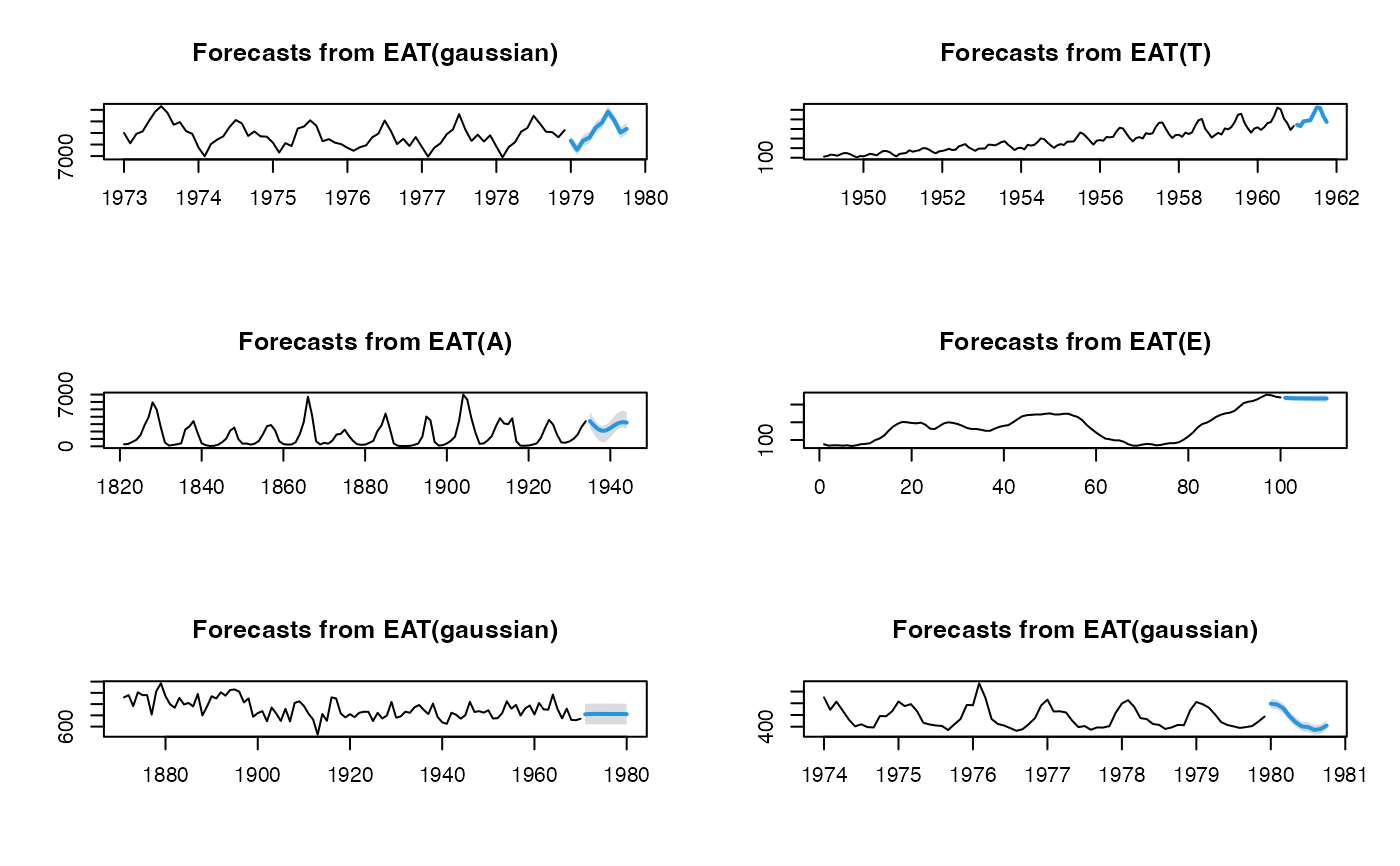
par(mfrow=c(3, 2))
plot(ahead::eatf(USAccDeaths, h=10, level=95))
plot(ahead::eatf(AirPassengers, h=10, level=95, type_pi = "T"))
plot(ahead::eatf(lynx, h=10, level=95, type_pi = "A"))
plot(ahead::eatf(WWWusage, h=10, level=95, type_pi = "E"))
plot(ahead::eatf(Nile, h=10, level=95))
plot(ahead::eatf(fdeaths, h=10, level=95))
