Ridge2 model
ridge2f.RdRandom Vector functional link network model with 2 regularization parameters
ridge2f(
  y,
  h = 5,
  level = 95,
  xreg = NULL,
  lags = 1,
  nb_hidden = 5,
  nodes_sim = c("sobol", "halton", "unif"),
  activ = c("relu", "sigmoid", "tanh", "leakyrelu", "elu", "linear"),
  a = 0.01,
  lambda_1 = 0.1,
  lambda_2 = 0.1,
  dropout = 0,
  type_forecast = c("recursive", "direct"),
  type_pi = c("gaussian", "bootstrap", "blockbootstrap", "movingblockbootstrap",
    "rvinecopula"),
  block_length = NULL,
  margins = c("gaussian", "empirical"),
  seed = 1,
  B = 100L,
  type_aggregation = c("mean", "median"),
  centers = NULL,
  type_clustering = c("kmeans", "hclust"),
  ym = NULL,
  cl = 1L,
  show_progress = TRUE,
  ...
)
Arguments
- y
A univariate of multivariate time series of class
ts(preferred) or amatrix- h
Forecasting horizon
- level
Confidence level for prediction intervals
- xreg
External regressors. A data.frame (preferred) or a
matrix- lags
Number of lags
- nb_hidden
Number of nodes in hidden layer
- nodes_sim
Type of simulation for nodes in the hidden layer
- activ
Activation function
- a
Hyperparameter for activation function "leakyrelu", "elu"
- lambda_1
Regularization parameter for original predictors
- lambda_2
Regularization parameter for transformed predictors
- dropout
dropout regularization parameter (dropping nodes in hidden layer)
- type_forecast
Recursive or direct forecast
- type_pi
Type of prediction interval currently "gaussian", "bootstrap", "blockbootstrap", "movingblockbootstrap", "rvinecopula" (with Gaussian and empirical margins for now)
- block_length
Length of block for circular or moving block bootstrap
- margins
Distribution of margins: "gaussian", "empirical" for
type_pi == "rvinecopula"- seed
Reproducibility seed for random stuff
- B
Number of bootstrap replications or number of simulations (yes, 'B' is unfortunate)
- type_aggregation
Type of aggregation, ONLY for bootstrapping; either "mean" or "median"
- centers
Number of clusters for
type_clustering- type_clustering
"kmeans" (K-Means clustering) or "hclust" (Hierarchical clustering)
- ym
Univariate time series (
stats::ts) of yield to maturities withfrequency = frequency(y)andstart = tsp(y)[2] + 1 / frequency(y). Default isNULL.- cl
An integer; the number of clusters for parallel execution, for bootstrap
- show_progress
A boolean; show progress bar for bootstrapping? Default is TRUE.
- ...
Value
An object of class "mtsforecast"; a list containing the following elements:
- method
The name of the forecasting method as a character string
- mean
Point forecasts for the time series
- lower
Lower bound for prediction interval
- upper
Upper bound for prediction interval
- sims
Model simulations for bootstrapping (basic, or block)
- x
The original time series
- residuals
Residuals from the fitted model
- coefficients
Regression coefficients for
type_pi == 'gaussian'for now
References
Moudiki, T., Planchet, F., & Cousin, A. (2018).
Multiple time series forecasting using quasi-randomized
functional link neural networks. Risks, 6(1), 22.
Examples
require(fpp)
print(ahead::ridge2f(fpp::insurance)$mean)
#> Quotes TV.advert
#> May 2005 14.76393 8.947782
#> Jun 2005 14.61841 8.862613
#> Jul 2005 14.56234 8.841193
#> Aug 2005 14.49305 8.809091
#> Sep 2005 14.43100 8.781208
print(ahead::ridge2f(fpp::usconsumption)$lower)
#> consumption income
#> 2011 Q1 -0.5227315 -0.7844227
#> 2011 Q2 -0.5076823 -0.9604548
#> 2011 Q3 -0.5062880 -0.8898860
#> 2011 Q4 -0.5036865 -0.9128285
#> 2012 Q1 -0.5032325 -0.9031703
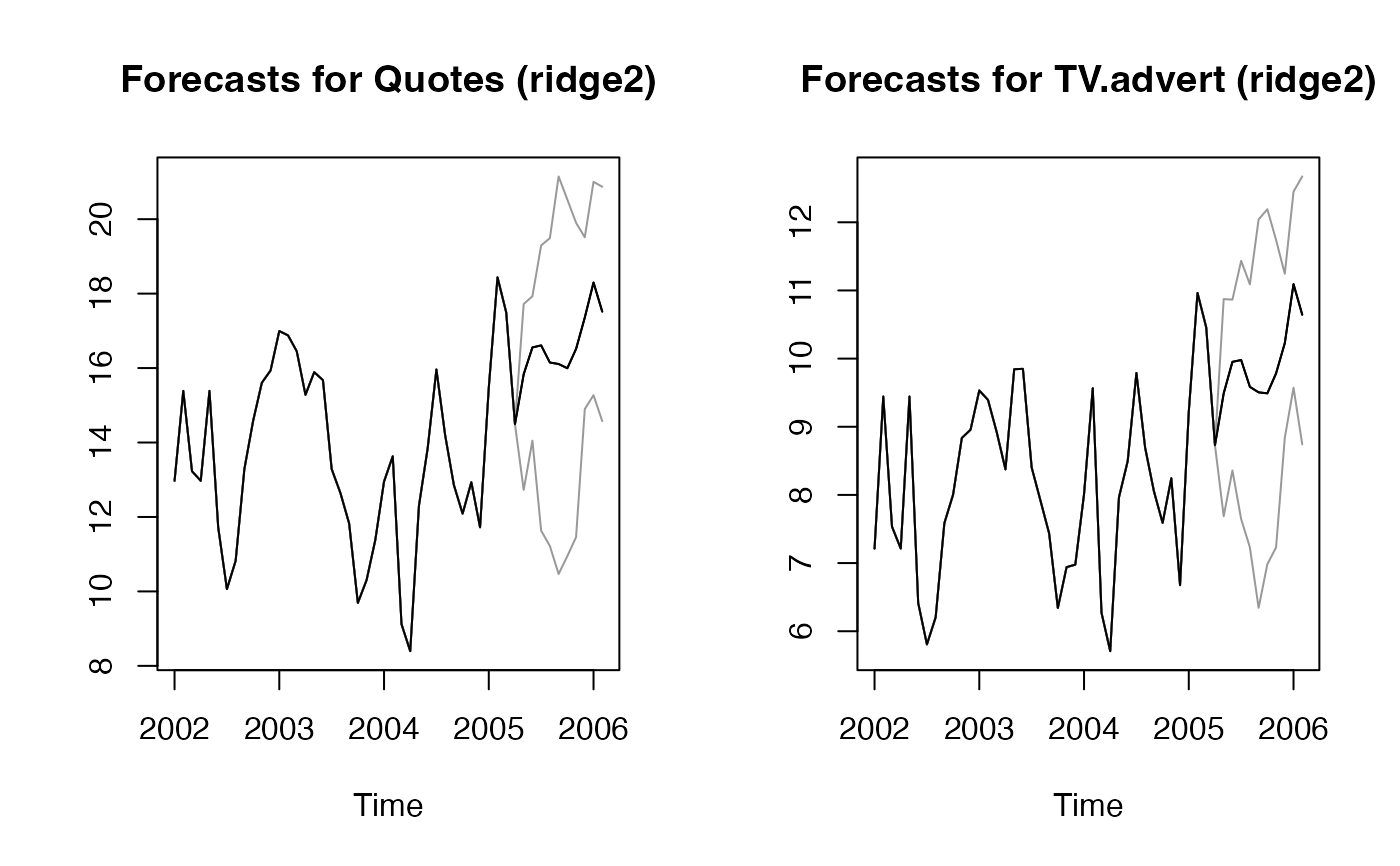
res <- ahead::ridge2f(fpp::insurance, h=10, lags=2)
par(mfrow=c(1, 2))
plot(res, "Quotes")
plot(res, "TV.advert")
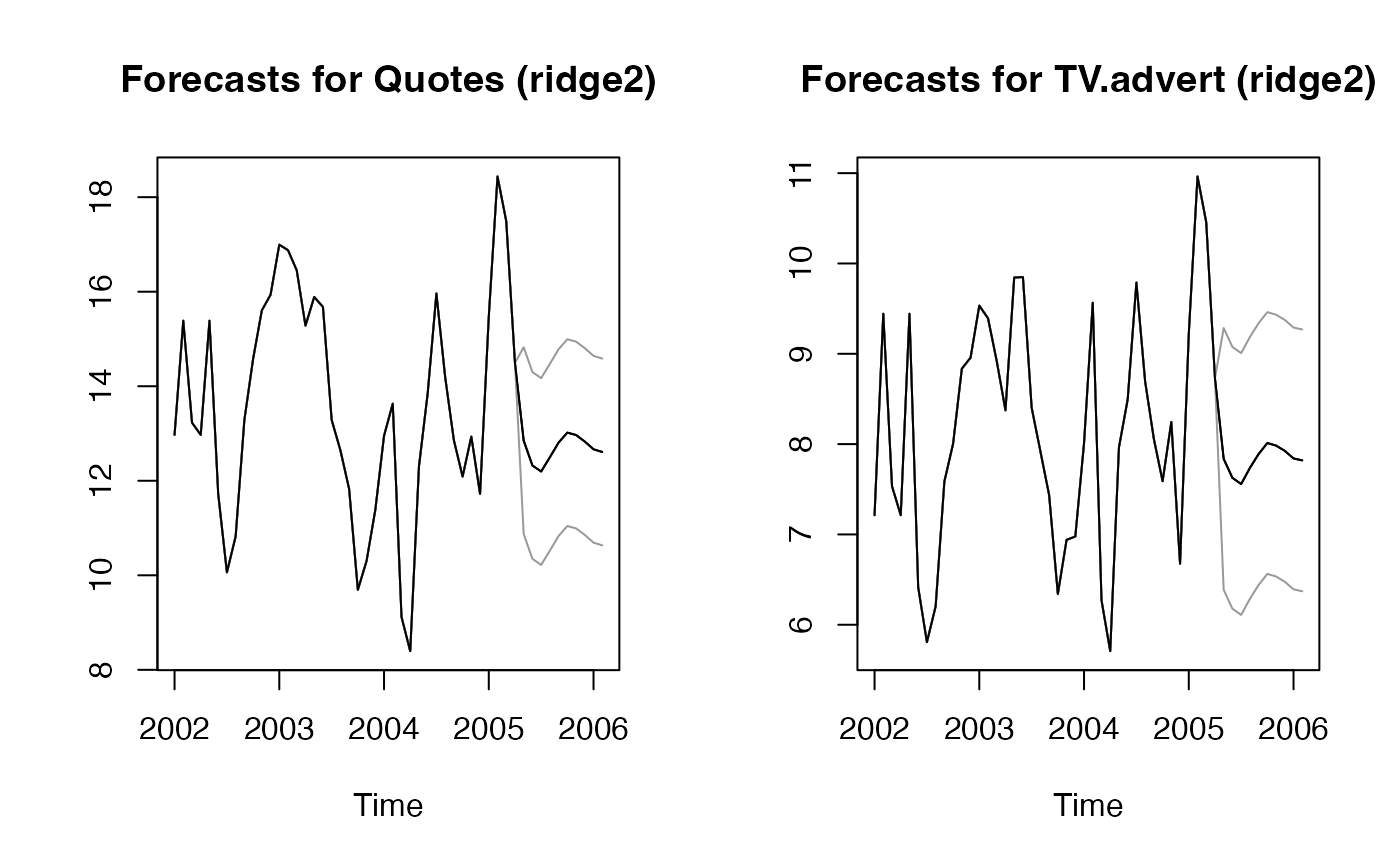 # include a trend (just for the example)
xreg <- as.numeric(time(fpp::insurance))
res2 <- ahead::ridge2f(fpp::insurance, xreg=xreg,
h=10, lags=2)
par(mfrow=c(1, 2))
plot(res2, "Quotes")
plot(res2, "TV.advert")
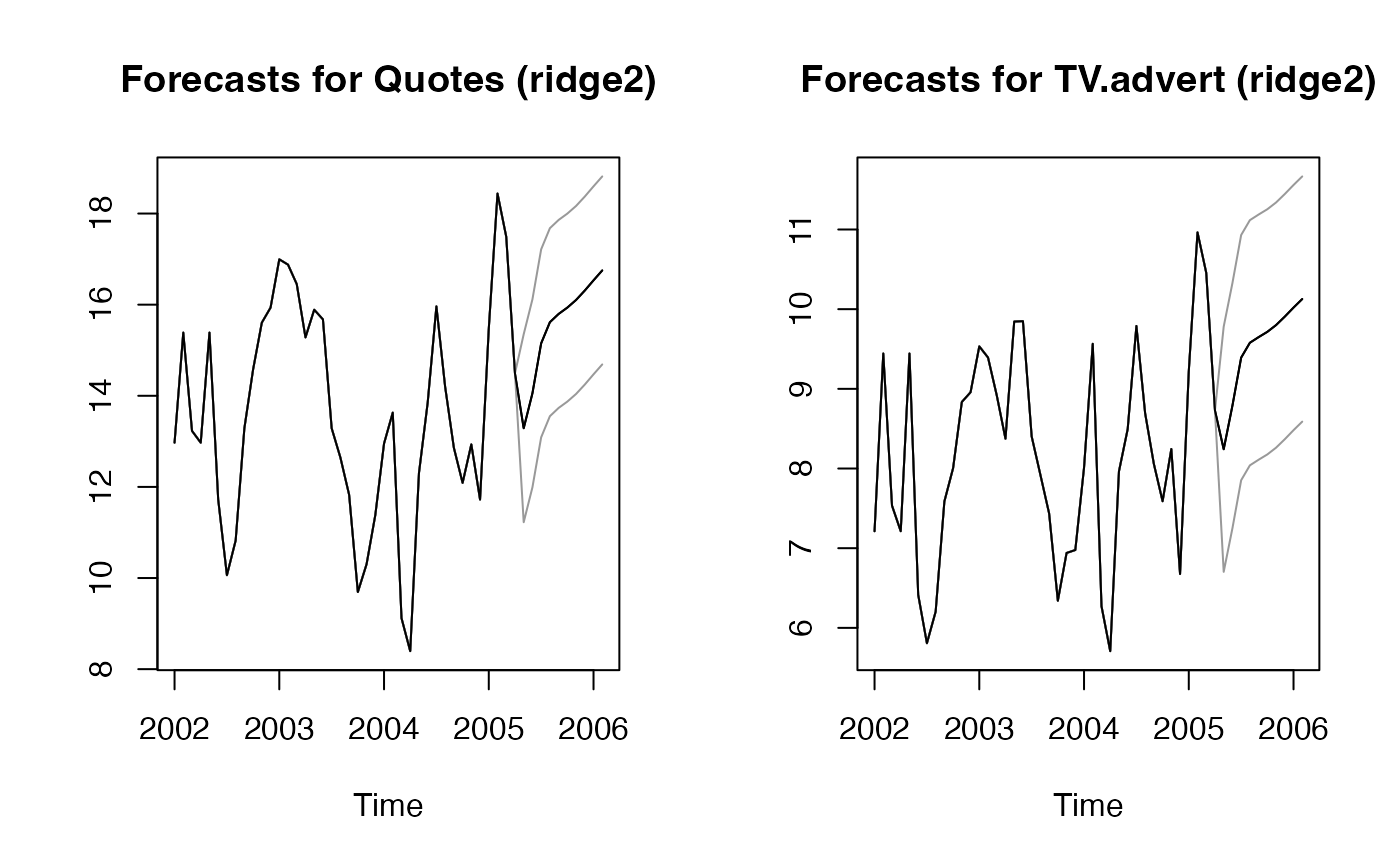 # block bootstrap
xreg <- as.numeric(time(fpp::insurance))
res3 <- ahead::ridge2f(fpp::insurance, xreg=xreg,
h=10, lags=1L, type_pi = "bootstrap", B=10)
#>
|
| | 0%
|
|======= | 10%
|
|============== | 20%
|
|===================== | 30%
|
|============================ | 40%
|
|=================================== | 50%
|
|========================================== | 60%
|
|================================================= | 70%
|
|======================================================== | 80%
|
|=============================================================== | 90%
|
|======================================================================| 100%
res5 <- ahead::ridge2f(fpp::insurance, xreg=xreg,
h=10, lags=1L, type_pi = "blockbootstrap", B=10,
block_length = 4)
#>
|
| | 0%
|
|======= | 10%
|
|============== | 20%
|
|===================== | 30%
|
|============================ | 40%
|
|=================================== | 50%
|
|========================================== | 60%
|
|================================================= | 70%
|
|======================================================== | 80%
|
|=============================================================== | 90%
|
|======================================================================| 100%
print(res3$sims[[2]])
#> Quotes TV.advert
#> May 2005 15.72942 9.514972
#> Jun 2005 14.09346 8.458399
#> Jul 2005 18.25350 10.789118
#> Aug 2005 17.97007 11.672310
#> Sep 2005 13.23870 8.172901
#> Oct 2005 15.38918 10.437795
#> Nov 2005 14.13069 9.070793
#> Dec 2005 10.83028 6.903871
#> Jan 2006 14.01583 8.671829
#> Feb 2006 17.93777 10.714967
print(res5$sims[[2]])
#> Quotes TV.advert
#> May 2005 15.97876 10.768360
#> Jun 2005 11.34974 7.525175
#> Jul 2005 10.98139 7.100955
#> Aug 2005 15.44516 9.621484
#> Sep 2005 16.08253 9.682221
#> Oct 2005 17.08198 9.809834
#> Nov 2005 18.47991 10.744276
#> Dec 2005 18.84287 10.886582
#> Jan 2006 18.50397 11.439328
#> Feb 2006 18.55954 11.717947
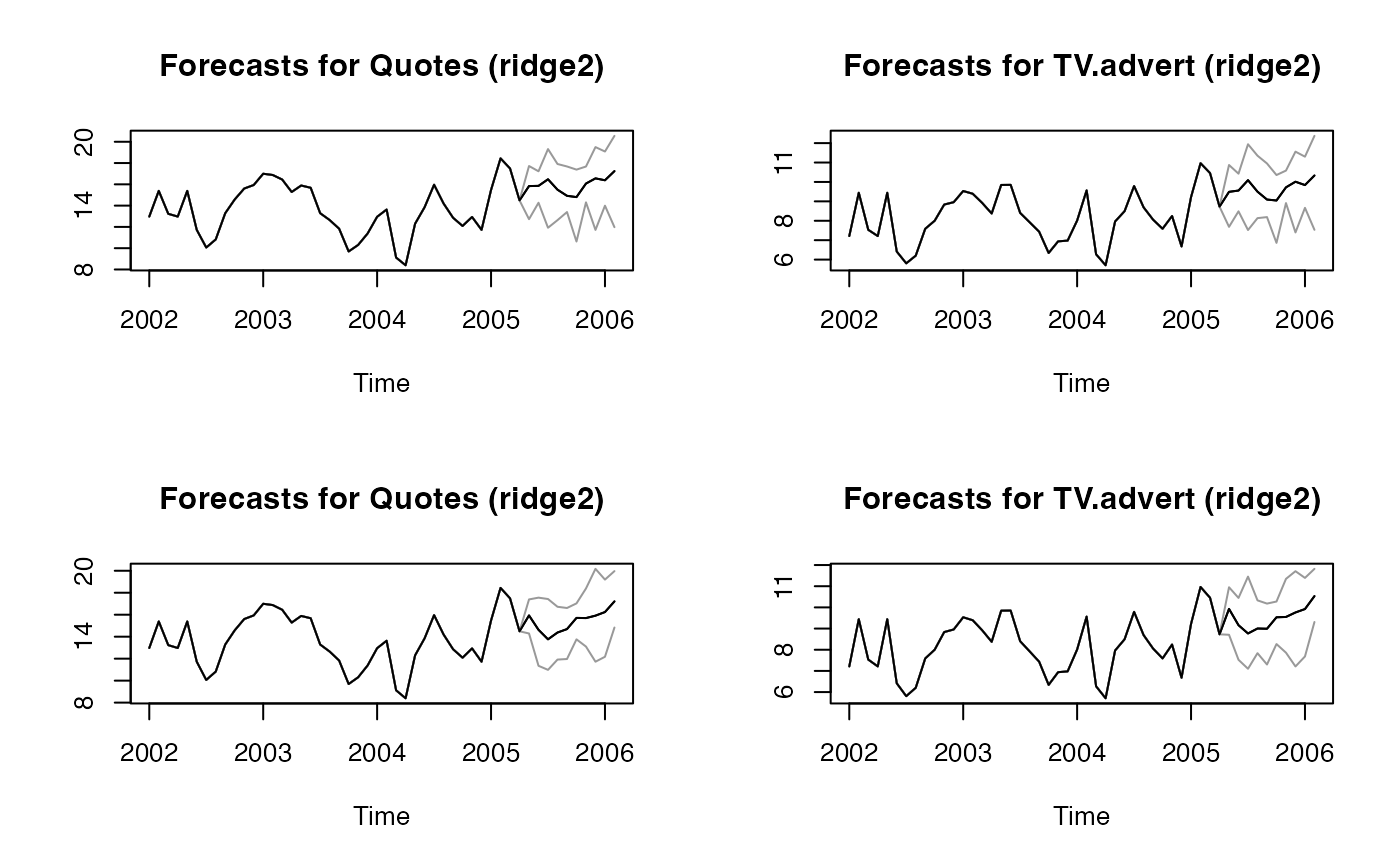
par(mfrow=c(2, 2))
plot(res3, "Quotes")
plot(res3, "TV.advert")
plot(res5, "Quotes")
plot(res5, "TV.advert")
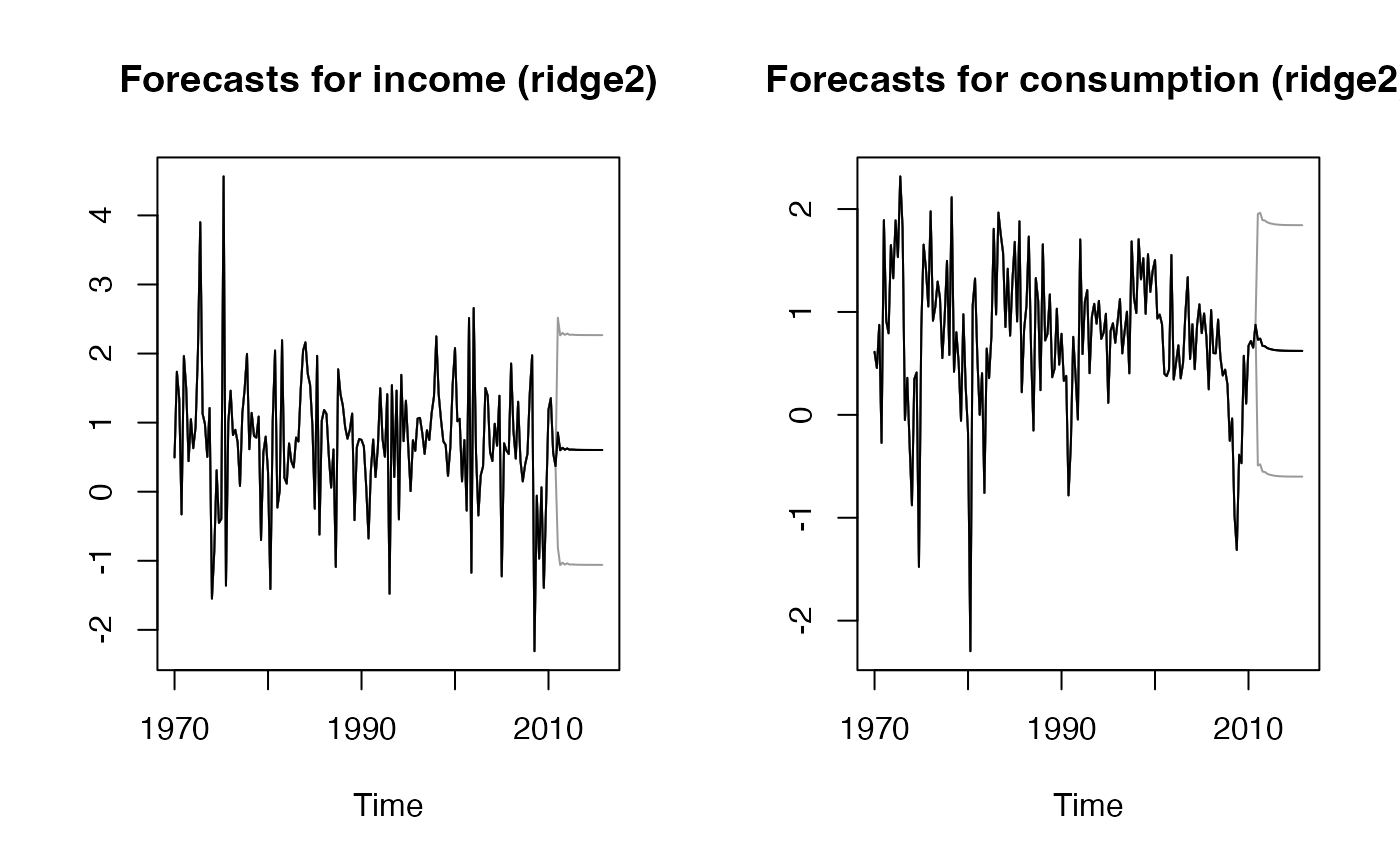
 res4 <- ahead::ridge2f(fpp::usconsumption, h=20, lags=2L,
lambda_2=1)
par(mfrow=c(1, 2))
plot(res4, "income")
plot(res4, "consumption")
 # moving block bootstrap
xreg <- as.numeric(time(fpp::insurance))
res6 <- ahead::ridge2f(fpp::insurance, xreg=xreg,
h=10, lags=1L,
type_pi = "movingblockbootstrap", B=10,
block_length = 4)
#>
|
| | 0%
|
|======= | 10%
|
|============== | 20%
|
|===================== | 30%
|
|============================ | 40%
|
|=================================== | 50%
|
|========================================== | 60%
|
|================================================= | 70%
|
|======================================================== | 80%
|
|=============================================================== | 90%
|
|======================================================================| 100%
print(res6$sims[[2]])
#> Quotes TV.advert
#> May 2005 15.72942 9.514972
#> Jun 2005 15.17064 9.280168
#> Jul 2005 13.04263 8.213002
#> Aug 2005 13.96530 8.942326
#> Sep 2005 12.28570 7.599110
#> Oct 2005 11.34549 6.871662
#> Nov 2005 14.12918 8.156717
#> Dec 2005 18.13043 10.335690
#> Jan 2006 19.56811 12.456360
#> Feb 2006 14.59436 8.906951
par(mfrow=c(1, 2))
plot(res6, "Quotes")
plot(res6, "TV.advert")
