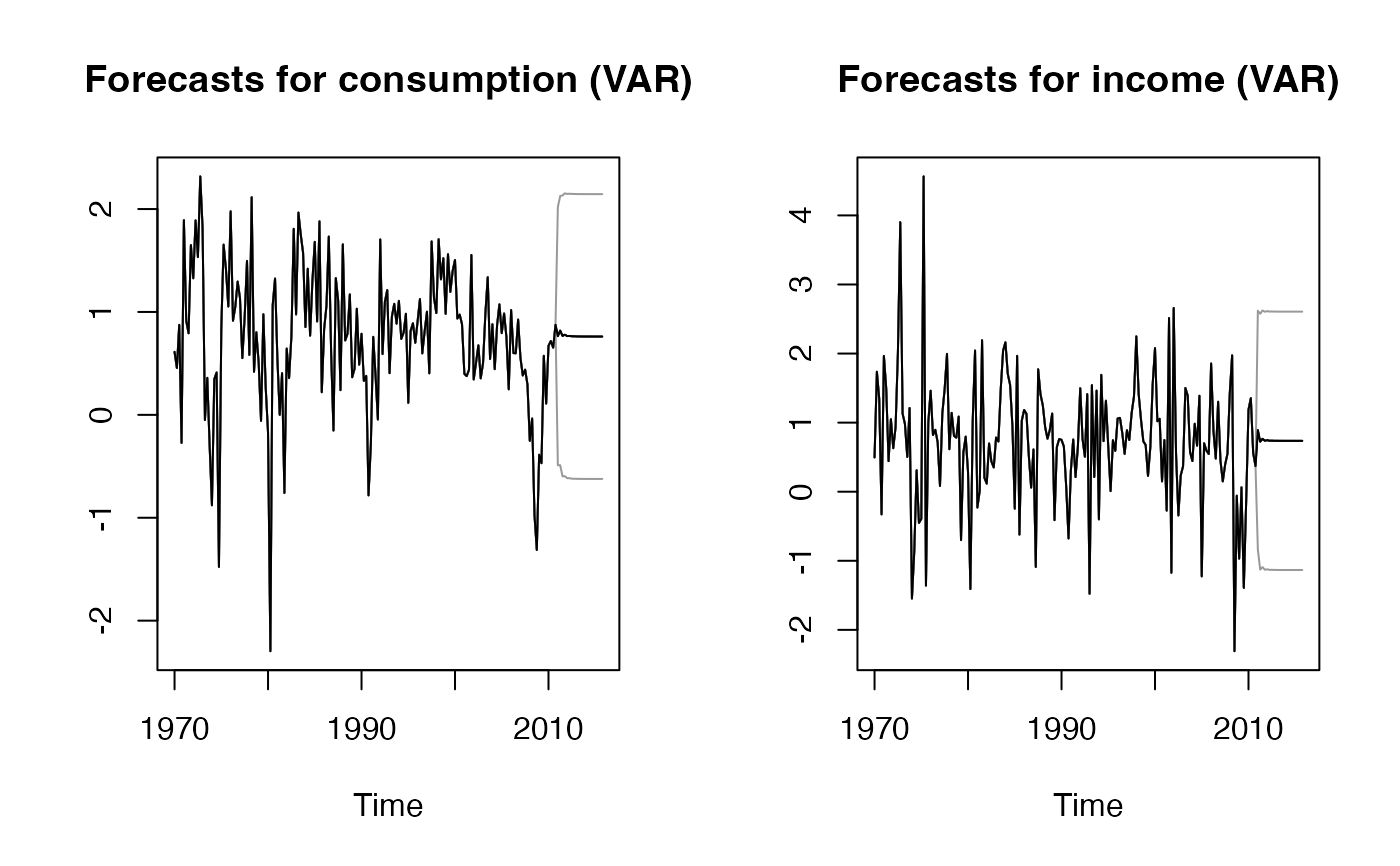
Vector Autoregressive model (adapted from vars::VAR)
varf.RdVector Autoregressive model adapted from vars::VAR (only for benchmarking)
varf(
  y,
  h = 5,
  level = 95,
  lags = 1,
  type_VAR = c("const", "trend", "both", "none"),
  ...
)
Arguments
- y
A multivariate time series of class
ts- h
Forecasting horizon
- level
Confidence level for prediction intervals
- lags
Number of lags
- type_VAR
Type of deterministic regressors to include.
- ...
Additional parameters to be passed to vars::VAR.
Value
An object of class "mtsforecast"; a list containing the following elements:
- method
The name of the forecasting method as a character string
- mean
Point forecasts for the time series
- lower
Lower bound for prediction interval
- upper
Upper bound for prediction interval
- x
The original time series
- residuals
Residuals from the fitted model
References
Bernhard Pfaff (2008). VAR, SVAR and SVEC Models: Implementation
Within R Package vars. Journal of Statistical Software 27(4). URL
http://www.jstatsoft.org/v27/i04/.
Pfaff, B. (2008) Analysis of Integrated and Cointegrated Time Series with R. Second Edition. Springer, New York. ISBN 0-387-27960-1
Examples
require(fpp)

print(varf(fpp::insurance, lags=2, h=10))
#> $mean
#>            Quotes TV.advert
#> May 2005 12.18625  7.496076
#> Jun 2005 11.32706  7.053645
#> Jul 2005 11.71033  7.268821
#> Aug 2005 12.62982  7.749828
#> Sep 2005 13.44896  8.163502
#> Oct 2005 13.85680  8.355460
#> Nov 2005 13.86539  8.341180
#> Dec 2005 13.65933  8.222100
#> Jan 2006 13.43491  8.100921
#> Feb 2006 13.30631  8.034485
#>
#> $lower
#>            Quotes TV.advert
#> May 2005 9.606273  5.550692
#> Jun 2005 7.696673  4.746624
#> Jul 2005 7.377925  4.757039
#> Aug 2005 7.828978  5.090650
#> Sep 2005 8.406300  5.423177
#> Oct 2005 8.725938  5.582815
#> Nov 2005 8.714092  5.558191
#> Dec 2005 8.502736  5.433765
#> Jan 2006 8.273739  5.308648
#> Feb 2006 8.141282  5.239921
#>
#> $upper
#>            Quotes TV.advert
#> May 2005 14.76623  9.441460
#> Jun 2005 14.95746  9.360665
#> Jul 2005 16.04273  9.780603
#> Aug 2005 17.43066 10.409005
#> Sep 2005 18.49161 10.903827
#> Oct 2005 18.98766 11.128105
#> Nov 2005 19.01668 11.124169
#> Dec 2005 18.81591 11.010435
#> Jan 2006 18.59608 10.893194
#> Feb 2006 18.47134 10.829050
#>
#> $x
#>            Quotes TV.advert
#> Jan 2002 12.97065  7.212725
#> Feb 2002 15.38714  9.443570
#> Mar 2002 13.22957  7.534250
#> Apr 2002 12.97065  7.212725
#> May 2002 15.38714  9.443570
#> Jun 2002 11.72288  6.415215
#> Jul 2002 10.06177  5.806990
#> Aug 2002 10.82279  6.203600
#> Sep 2002 13.28707  7.586430
#> Oct 2002 14.57832  8.004935
#> Nov 2002 15.60542  8.834980
#> Dec 2002 15.93515  8.957255
#> Jan 2003 16.99486  9.532990
#> Feb 2003 16.87821  9.392950
#> Mar 2003 16.45128  8.918560
#> Apr 2003 15.28118  8.374120
#> May 2003 15.88901  9.844505
#> Jun 2003 15.67747  9.849390
#> Jul 2003 13.28780  8.402730
#> Aug 2003 12.64484  7.920675
#> Sep 2003 11.82771  7.436085
#> Oct 2003  9.69184  6.340490
#> Nov 2003 10.30415  6.939995
#> Dec 2003 11.38253  6.977100
#> Jan 2004 12.95149  8.010201
#> Feb 2004 13.63092  9.565460
#> Mar 2004  9.12098  6.272510
#> Apr 2004  8.39468  5.707495
#> May 2004 12.30076  7.963540
#> Jun 2004 13.84831  8.494221
#> Jul 2004 15.96246  9.789085
#> Aug 2004 14.19738  8.692825
#> Sep 2004 12.85922  8.057230
#> Oct 2004 12.08837  7.588995
#> Nov 2004 12.93375  8.244881
#> Dec 2004 11.72235  6.675540
#> Jan 2005 15.47126  9.219604
#> Feb 2005 18.43898 10.963800
#> Mar 2005 17.49186 10.456290
#> Apr 2005 14.49168  8.728600
#>
#> $level
#> [1] 95
#>
#> $method
#> [1] "VAR"
#>
#> $residuals
#>         Quotes   TV.advert
#> 1  -1.21221475 -1.08872613
#> 2  -0.60932129 -0.82860344
#> 3   1.01230477  1.18158972
#> 4  -2.71890475 -2.20776113
#> 5  -2.72251102 -1.70919352
#> 6  -0.55627892 -0.54141690
#> 7  -0.20479384 -0.28997814
#> 8  -0.97575658 -0.94287829
#> 9  -0.70287179 -0.39170276
#> 10  0.29049077  0.01604860
#> 11  1.18975618  0.48869323
#> 12  0.18234760 -0.09851074
#> 13  0.29310649 -0.26448239
#> 14 -1.07851304 -0.80589860
#> 15  1.01052375  1.42900180
#> 16  2.49178770  1.84290932
#> 17 -0.05105206  0.08295490
#> 18  1.22919439  0.62561003
#> 19 -0.52505090 -0.26983308
#> 20 -2.14850232 -1.06600517
#> 21  0.49178004  0.55454269
#> 22  0.32815535 -0.16560400
#> 23 -0.65047836 -0.27077838
#> 24 -0.01554935  1.28542931
#> 25 -1.25939039 -0.81665029
#> 26 -0.15783738 -0.31178759
#> 27  2.20122635  1.34517712
#> 28 -0.34491421 -0.25167808
#> 29  1.42837171  0.97562261
#> 30 -1.00797836 -0.46675086
#> 31  0.27751196  0.27900155
#> 32  0.28493881  0.19352529
#> 33  0.95161090  0.75836854
#> 34 -1.03600764 -1.27947700
#> 35  1.83451752  1.13630731
#> 36  2.30512260  1.55003411
#> 37  0.26021409  0.35235401
#> 38 -0.08503400 -0.02945364
#>
#> attr(,"class")
#> [1] "mtsforecast"

res <- varf(fpp::usconsumption, h=20, lags=2)

par(mfrow=c(1, 2))
plot(res, "consumption")
plot(res, "income")
